Archives
- Home
- News
- Posts
- Agri Orbit
- Climate-smart livestock farming: Part 2
Climate-smart livestock farming: Part 2
- Agri Orbit
-
Mar 22
- Share post

Veld that can withstand a volatile climate
In the first article in this series on climate-smart livestock farming, we learned that only that part of the rainfall that seeps into the soil and is transpired by the desired grazing plants, will contribute to efficient feed production and therefore efficient rainfall. The rest is lost to runoff, deep drainage or evaporation from the soil surface.
The rain in the rain gauge is therefore not all that matters – it is the water that ends up in the soil and that is used by advantageous plants to produce feed, that makes the difference. It embodies efficient rainfall and is the focus of climate-smart livestock producers who aim to make every drop count.
In this month’s instalment, we look at the impact veld condition has on sustainable forage production, especially in the drier parts of our country.
Better veld, better pasture
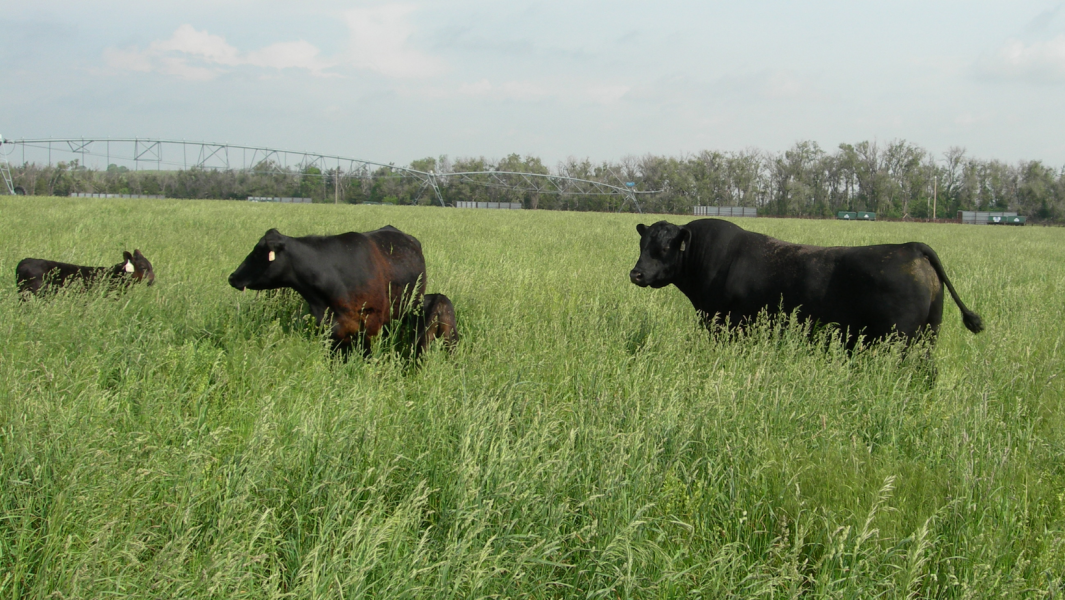
Research conducted in the arid and semi-arid regions of South Africa since the 1980s has shown that the better the condition of the veld, the higher and more stable the forage produced and the better the quality of the feed. It also markedly improves the veld’s drought tolerance and, ultimately, its profitability.
Prof Hennie Snyman, professor emeritus of rangeland science at the University of the Free State, conducted pioneering research in South Africa regarding the relationship between the condition and hydrology (water balance) of veld. He was recently named one of the world’s top 2% scientists by Stanford University in the United States. The research he performed in the central Free State (Table 1), supplemented by other research in South Africa, is cited in this article, among others.
Table 1: The hydrological and production characteristics of veld in different conditions in the central Free State (1977 to 1996); average annual rainfall was 530mm. (Source: HA Snyman, 1999, 2008)
Hydrological and production characteristics Veld condition
Good Average Poor
Rainfall runoff 3,5% 5,6% 8,7%
Rainfall deep drainage 0,5% 0,2% 0,1%
Basal soil cover 8,3% 6,9% 2,9%
Annual loss of topsoil (t/ha) 0,41 1,2 3,55
Relative annual carbon loss from upper 300mm soil (kg/ha/year) 0 2 659 5 225
Relative annual nitrogen loss from upper 300mm soil (kg/ha/year) 0 180 331
Water use efficiency (kg feed/ha/mm water produced) 2,5 1,6 0,8
Dry matter production (kg/ha/year) 1 238 768 368
Variability of dry matter production (kg/ha/year) 313 – 2 678 200 – 1 633 15 – 889
Crude protein production (kg/ha/year) 141 97 32
Veld condition and water balance
In the case of good veld, Table 1 indicates that, between 1977 and 1996, approximately 3,5% of rainwater was lost annually due to runoff – in other words, water that did not infiltrate the soil. Put differently, an average of 19mm of the annual average rainfall of 530mm was lost from good veld.
In the case of average veld, almost twice as much of the yearly rainfall washed away (5,6% or 30mm), and rainwater runoff in poor veld was almost three times as much (8,7% or 46mm). Hence, the poorer the condition of the veld, the more water is lost and the drier the soil becomes.
The data can also be approached from another angle. Every millimetre of rain that falls on one hectare of land represents 10 000ℓ of water. Thus, a 46mm loss in annual rainfall (as can be seen in poor veld) constitutes a loss of 460 000ℓ of water/ha/year that is not available for feed production. A 1 000ha farm will therefore lose 46 million litres of rainwater every year.
The central Free State is relatively flat. Drainage percentages should therefore be significantly higher in areas with steeper slopes.
Table 1 shows that the amount of rainwater that replenishes the groundwater (also called deep drainage) is more than twice as much in good veld than in average veld (0,5 versus 0,2% of annual rainfall), and five times more than in poor veld (0,1%). Therefore, the better the veld’s condition, the better the amount of water that replenishes the underground source.
Plant cover and topsoil losses
Approximately 17% more soil is covered with plants in good veld than in average veld (expressed as the percentage of soil covered by the basal parts of the plants). Similarly, good veld covers roughly 65% more of the soil than the plant cover on poor veld.
The deterioration of the veld exposes more soil to the atmosphere, leading to significantly more water being lost through evaporation. The water that evaporates directly from the soil surface constitutes a loss of rainwater to the livestock producer, as it is not absorbed by plants and therefore does not contribute to veld production.
In good veld 0,41t/ha/year of topsoil is lost to erosion, in average veld 1,2t/ha/year is lost, while a whopping 3,55t/ha/year is lost in poor veld. To put this in perspective: 1ha of soil that is 1mm deep, with a bulk density of 1,5g/cm³, weighs around 15 tons. Thus, roughly 0,02mm of soil had been lost each year in good veld, or 0,36mm over the 18 years of research. In the case of poor veld, the loss amounted to approximately 0,24cm of topsoil per year, or 4,3mm over 18 years.
The well-known American broadcaster, Paul Harvey, who is known for his “So God made a farmer” speech in 1978, once said that “man, despite his artistic pretensions, his sophistication, and his many accomplishments, owes his existence to a six-inch layer of topsoil and the fact that it rains”.
In addition to the valuable topsoil that is lost, poor veld also loses substantial amounts of carbon (organic matter) and nitrogen from the soil every year. Carbon is one of the most crucial elements determining the soil’s water-holding capacity.
Feed production
Water consumption efficiency (WUE) is the amount of water a plant uses to produce one gram of forage. Veld in good condition produces twice as much forage per millimetre of water than average veld, and around four times more forage per millimetre of water than poor veld, even though the same amount of rain is measured in the rain gauge for all three veld conditions.
Also remember that the soil of poor veld is considerably drier than that of good veld, which doubles the deficit.
The protein content of poor veld is lower than that of good veld. Good veld produces two to four times more crude protein per hectare than veld in medium and poor condition.
The year-on-year variation in veld production also differs substantially, with good veld’s worst production not much lower than the best production of poor veld. The drier the year, the greater the difference in the feed produced by good and poor veld.
More frequent forage shortages are experienced from poor veld than good veld. The research of the Free State grazing specialist, Dr Mias van der Westhuizen, confirms this (Table 2). The incidence of artificial droughts therefore increases as the condition of the veld deteriorates. An artificial drought is brought about by a shortage of grazing due to the poor condition of the veld and not limited rainfall.
Table 2: The probability of feed shortages given different veld conditions (Source: M van der Westhuizen, 2020)
Region Veld condition
Excellent Good Fair Poor
Central Free State(550mm) 5%* 10% 48% 99%
Kuruman(420mm) 22%* 33% 56% 87%
Upington(200mm) 27%* 45% 69% 98%
*Inherent climatological risk of drought.
Better veld, bigger profit
The icing on the cake is that veld in good condition yields more profit per hectare than veld in poorer condition. In a study in 1987, rangeland scientist A Moore and agricultural economists A Odendaal compared the profitability of veld under different conditions. For every R100 profit per hectare on good veld, the profit generated from average and poor veld only amounted to R64/ha and R18/ha respectively.
Thus, the better the condition of the veld, the higher and more stable the forage produced and the better the quality of the fodder, which will lead to increased profitability. The drought tolerance of the veld, as well as its drought endurance will also be improved, leading to production that is more sustainable.
In a nutshell: good veld is the best insurance against the temperamental nature of a volatile climate. – Dr Louis du Pisani, independent agricultural consultant


